Next week will be a short one for U.S. markets, with Wall Street shuttered Monday for MLK Day.
Hopefully many of you get the day off and have a chance to relax.
As far as this week, well… traders continue to pump up this overinflated basketball of a market, despite some cracks at the seams.
It appears no matter what happens, stocks are making record highs every single day.
And while I fully expect this decade-plus bull market to run out of steam sooner rather than later, I’ve learned that stepping in front of the tracks when a locomotive is set to pass—costly and dangerous.
So against this backdrop of all-time highs, I thought I’d outline one way to time your profit-taking — and show you how it worked on a pair of FAANG stocks — as well as how to identify entry points.
Because while I’m no longer a poor elementary teacher swimming in student loan debt, I will always be an educator at heart, and I only want the best for my subscribers — of Weekly Windfalls and other services — like Sean here (thanks, man).
Table of Contents
Who is Fibonacci?
No, Leonardo Fibonacci (aka – Leonardo Bonacci) is not a RagingBull guru… but he damn well could’ve been.
The Italian mathematician was born around 1170, and as a young man traveled throughout the Mediterranean learning how various merchants did math.
He discovered that the Roman numeral system was much more difficult to calculate than the Hindu-Arabic numeral system, and said as much in his Liber Abaci book, which introduced the decimal place system to the Western world.
Studying the growth of the rabbit population, Fibonacci popularized his now famous sequence of numbers.
The Fibonacci sequence begins with 0 and 1, and each subsequent number is the sum of the two previous numbers.
So, 0, 1, 1, 2, 3, 5, 8, 13, 21, etc…
The sequence can be found in several unexpected places, including in architecture and electrical networks, and the Fibonacci spiral can be seen all throughout nature, like in the structure of pineapples and daisies.
It was even incorporated into the plot line of The Da Vinci Code and an episode of “Criminal Minds.”
But enough about that underachiever! (I kid.)
Fibonacci Retracements
If you’ve been with me a while, you already know that one of my favorite patterns to trade is the Fibonacci retracement.
When a stock makes a huge move higher in short order, and then stalls, it will often retrace — or backpedal — to support near the key Fibonacci lines, usually giving back 23.6%, 38.2%, 61.8%, or 76.4%, with 50% an unofficial (but important) level.
For example, if Stock XYZ rallies from $100 to $200, it might eventually drop back to find support near $177, which would be a nearly 23.6% retracement of that rally.
Pullbacks to these Fibonacci retracement levels often act as zones to buy a stock (in Jason Bond Picks) or initiate a bull credit spread (in Weekly Windfalls ).
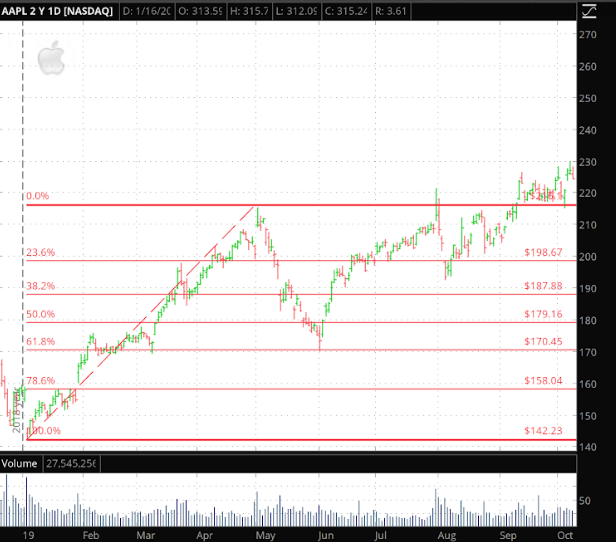
Take a look at good ol’ Apple (AAPL).
Shares of the iPhone maker started 2019 on an absolute tear, rallying from around $140 at the start of the year to well above $210 by late April.
You can see on the chart below that I’ve placed the 0% Fibonacci line at the top of that rally, and the 100% line at the bottom.
Therefore, a 100% retracement would mean AAPL forfeited all its gains.
As you can see, after peaking in the second quarter, the stock took a dive, with the bleeding ultimately stopping around $170 — a 61.8% Fibonacci retracement of that rally.
The rebound subsequently stalled again back around AAPL’s previous highs, before the shares ultimately broke north of the range in September.
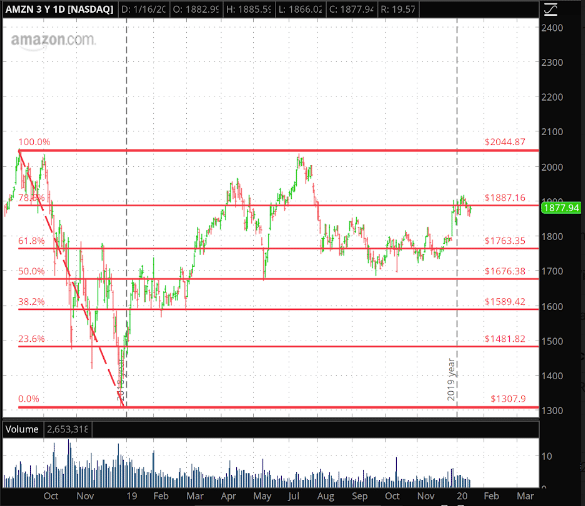
On the flip side, stocks that have taken a beating could also bounce into Fibonacci retracement or other key percentage levels.
For instance, during the fourth-quarter 2018 drubbing, Amazon (AMZN) went from being north of $2,000 (my 100% marker) to falling to around $1,300 (my 0% marker) in short order.
The stock’s early 2019 rebound hesitated a bit in the $1,700 region, which represented a 50% retracement of that sell-off.
Once the shares got beyond that area, gains once again were capped just above $2,000, and subsequent retreats were contained around $1,700.
Now, AMZN is struggling to get past the $1,900 area — a 78.6% Fibonacci retracement — indicating that even more than a year later, these levels are still in play.
Fibonacci Extensions
Now, how do you use Fibonacci levels to set profit targets?
While there are two points you need to set for Fibonacci retracements (0% and 100%; the rest should auto-populate beyond that on most trading platforms), on many platforms there are three data points to set with extensions, assuming you’re measuring an uptrend:
- First, you’ll set your 0% at the swing low (or swing high, if you’re looking at a downtrend)
- Then, you’ll set your 100% at the swing high (or low ^^^)
- Finally, you’ll set your third point back at a swing low (or high ^^^)
This should populate Fibonacci extensions for you — or at least one of the most-watched extensions, at 161.8%.
In platforms like ThinkorSwim, and many others, you can manually set additional Fibonacci extensions.
Now, I’ve seen different traders plug in different sets of numbers. But it should be noted that most traders use Fibonacci levels in reverse order above 100% to calculate extensions.
So, in the example below, I included the 123.6% level and the 161.8% level, and while it’s not a Fibonacci extension, I included the round 150% level, too.
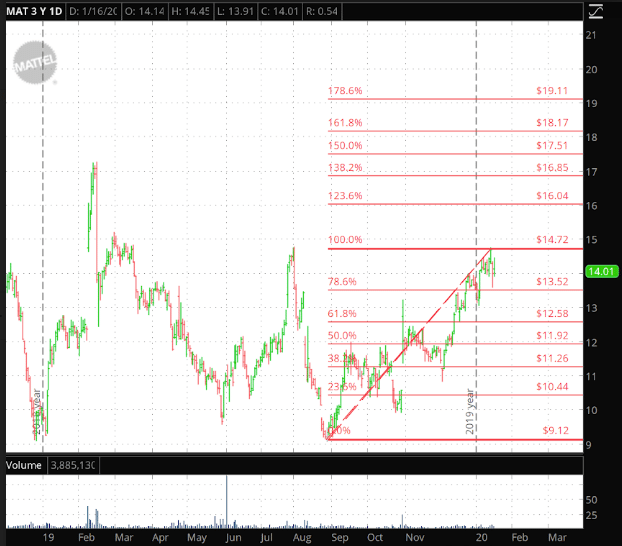
That said, let’s take a look at Mattel (MAT) stock.
The shares went from single digits in August to peaking around $13 by the middle of the fourth quarter, with help from a big-volume bull gap.
They then went on to retrace 50% of that surge by December, testing support just above $11.
As you can see, the shares subsequently moved beyond their former peak before the start of 2020, though upward momentum once again ran out of steam, this time just shy of $15.
This level represented a 138.2% Fibonacci EXTENSION of the initial rally.
It’s also the same region as MAT’s mid-2019 high.
As such, it seems some traders took profits at this level, as the stock has since taken a breather.
Of course, some of the recent losses were due to dismal holiday sales figures from Target (TGT), which said toy sales were particularly lackluster in December.
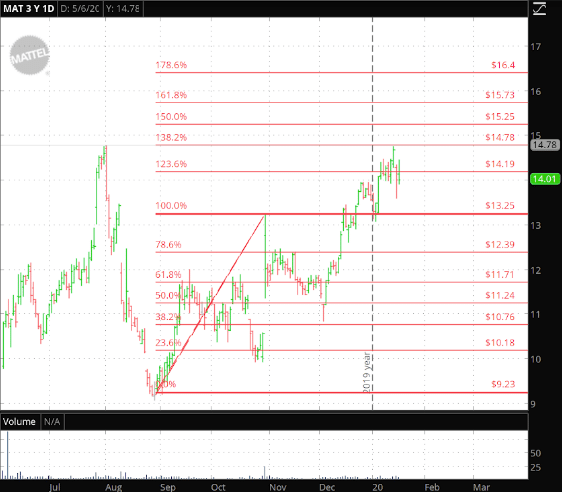
Looking at it another way — using the same 0% marker from August, but adjusting the 100% level to MAT’s recent high around $14.72 — one could surmise that if the stock can get past $15, the next area to take profits might be just above $16, which is a 123.6% Fibonacci extension of that longer-term rally.
In conclusion, guys and gals, I hope this lesson helps propel your trading, and aids you in identifying where stocks might stall — to either the upside or the downside.
The important takeaways here are twofold:
- Fibonacci retracements are a great way to find ENTRY points for a trade
- Fibonacci extensions are interpreted differently by different traders, but they’re a great way to identify EXIT points for a trade
As with any other indicator or form of technical analysis, the Fibonacci sequence shouldn’t be traded on alone.
Make sure you’re using other tools to help identify trends — like overbought/oversold scans, for instance — and don’t go into a trade unless the SETUP and the PLAN are concrete.
That’s my philosophy in Weekly Windfalls — and if you upgrade to the premium version today, you can watch me trade these indicators and more in REAL TIME.
[Ed. Note: Jason Bond runs
JasonBondPicks.com and TheWeeklyWindfalls.com. In 2015 he earned a 180% return on his money. Then in 2016 he turned a $100,000 account into $430,000! Discover How He Did It]
Source: ragingbull.com | Original Link