Bank earnings will be a big theme this week, with JPMorgan Chase (JPM), Citigroup (C), and Wells Fargo (WFC) among the names reporting today.
A handful of other financial names are slated to report later this week, too.
As such, I thought I’d outline one technical indicator that can act as an alarm for trend reversals: the Parabolic SAR.
I know, I know – it sounds like some kind of fatal disease. (“Sorry to be the bearer of bad news, Linda, but your test came back positive for… Parabolic SAR. You should really start making arrangements.”)
Joking aside, though, this indicator has been around for years – long before online trading and interactive chart analysis – and it’s still a favorite among many Wall Street pros for good reason.
So follow me as we dive into the Parabolic SAR, and outline a couple of potential bullish and bearish signals on a pair of banks before earnings tomorrow.
— RECOMMENDED —
YOU’LL NEVER WANT TO TRADE WITHOUT THIS. UNPARALLELED CONSISTENCY AND UNLIMITED OPPORTUNITY, EVERY DAY.
Table of Contents
The Parabolic Wut?
In the simplest terms, the Parabolic SAR (Stop and Reverse) indicator provides potential entry and exit signals and often acts as an alarm for trend reversals.
Many traders use the indicator to identify stop-loss targets, but for the purposes of this article, we’re going to dive into how it’s used to generate buy and sell signals on a stock.
Now, I’m not going to get into the nitty-gritty on how the Parabolic SAR is calculated, because it’s complex and makes my head spin.
Just know that settings can be adjusted to make the indicator more or less sensitive.
The default for the “step” (aka – the rate of change, or the “acceleration factor”) is 0.02, and the default for the “maximum value” is 0.20. This is what we’ll be using in our examples later on.
But, in order to make the indicator more sensitive, one could increase the step to, say, 0.04. However, if the step is too high, the Parabolic SAR could produce more frequent – and often fake-out – signals.
The sensitivity of the indicator can be decreased by decreasing the step to, say, 0.01. This setting would provide looser signals and stops.
Now, the Parabolic SAR appears as a series of dots.
The dots will be underneath the stock price when the shares are in an uptrend, and above the stock price when the shares are in a downtrend.
Typically, traders will buy when the dots move below the stock, which can signal a reversal higher on the horizon.
On the flip side, they’ll short the shares when the dots move above the stock, which can signal the start of a pullback.
It should be noted that the Parabolic SAR isn’t very effective when a stock is moving sideways, because the indicator will yo-yo too much and give off false signals. As such, it’s best used on stocks with a trend already present.
Now, on to what you came for…
PNC Indicator Flips Ahead of Earnings
PNC Financial (PNC) will report earnings ahead of the opening bell tomorrow.
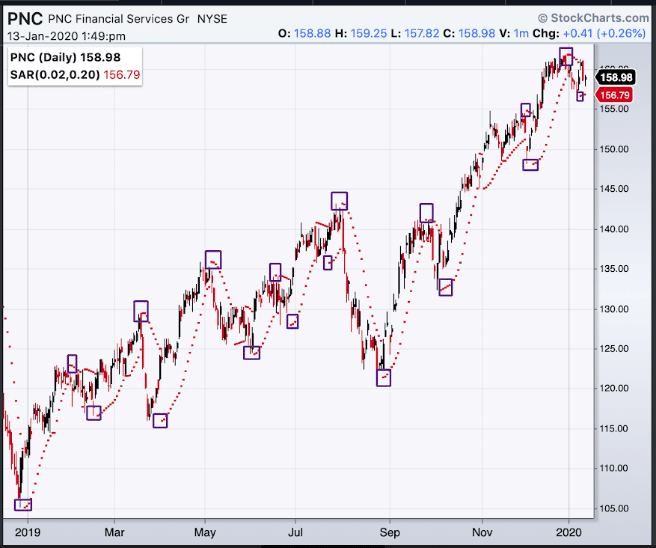
The stock has been a monster over the past year, and peaked above $161 earlier this month.
Shortly before that top, the stock’s Parabolic SAR flipped, moving above PNC’s price bars – suggesting a pullback was in the cards.
Sure enough, the security backpedaled, dipping to around the $158 level last week.
Now, though, the Parabolic SAR is back below the price bars, hinting that another leg higher could be coming soon.
As you can see on the chart below, these signals have been fairly accurate in predicting short-to-intermediate term pivot points for PNC over the past year.

Still, keep in mind that when it comes to earnings reactions, nothing is guaranteed.
And know that I’m not putting on an official trade in Weekly Windfalls, but for educational purposes, let’s break it down as if I were.
With the stock trading around $159, we could put on a bull put spread by:
- Selling the weekly 1/24 157.50-strike put for the bid price of $2.26
- Buying the weekly 1/24 155-strike put for the ask price of $1.49
Since we received more money for the sold put than we paid for the bought put, our spread would be established for a net credit of 77 cents – that’s the most we can possibly make on the trade.
The goal of the spread is for PNC shares to stay above $157.50 (our sold put strike) during the options’ lifetime.
We will make at least a little money as long as the stock stays above breakeven at $156.73 (sold put strike minus net credit).
And that’s why they call it “the casino strategy,” guys and gals. Because we can make money if PNC stock does one of three things:
- Moves higher
- Stays put
- Moves slightly against us
If PNC ends up tanking after earnings, the bought put acts as an “insurance policy,” limiting our losses to $1.73 (difference between strikes minus net credit).
BAC Parabolic SAR Points to Backtrack
Bank of America (BAC) will also report earnings ahead of tomorrow’s session.
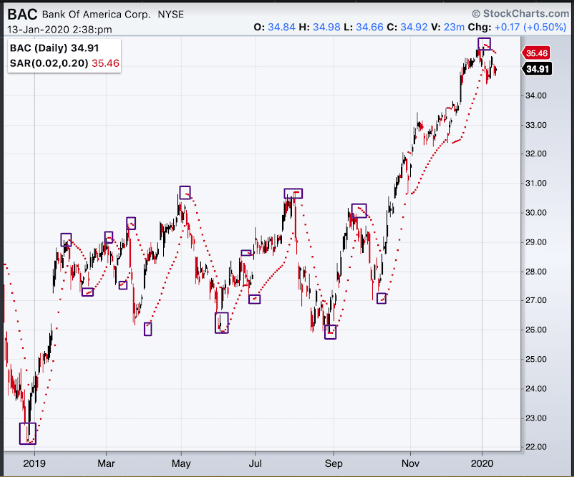
The stock was range-bound between $26 and $30 for most of 2019, before enjoying a big bullish breakout at the start of the fourth quarter.
BAC stock ultimately peaked around $36 near the turn of the year, but has since taken a breather to trade around $35.
However, the Parabolic SAR is now above BAC’s price bars, and has been for the longest stretch since September – a signal that predicted the security’s last major pullback.

Now again, I’m not saying I’m putting on an official Weekly Windfalls trade here, but for S&Gs, let’s break one down.
With the stock trading just shy of $35, we could put on a bear call spread by:
- Selling the weekly 1/24 35.50-strike call for the bid price of $0.42
- Buying the weekly 1/24 36.50-strike call for the ask price of $0.15
Again, since we received more money for the sold option than we paid for the bought option, our spread would be established for a net credit of 27 cents – that represents our maximum potential reward.
The goal of the spread is for BAC to stay below $35.50 (our sold call strike) during the options’ lifetime, which ends next Friday, Jan. 24.
We will make at least a little money as long as the stock stays south of breakeven at $35.77 (sold call strike plus net credit).
Once again, this demonstrates why I love “the casino strategy” – because it allows traders to make money one of three ways. For BAC, the spread would profit if the stock:
- Moves lower
- Stays put
- Moves slightly against us
If BAC stock ends up rallying after earnings, the bought call acts as a hedge, capping our risk at 73 cents (difference between strikes minus net credit).
Word to the Wise
Before I wrap up, just one more warning about earnings season…
All the preparation and technical analysis in the world can’t 100% predict how a stock will react to earnings, so when you place trades ahead of a report, you’re incurring more risk than usual for a move against you.
But as I’ve said a few times already, the vertical credit spreads we trade in Weekly Windfalls give you a relatively high probability for success, since you can profit as long as the stock doesn’t make a massive move in the wrong direction.
That said, I hope you’ve enjoyed our lesson on the Parabolic SAR, and use this indicator in your own trading to help identify the end of trends.
For even more options education, upgrade to the premium version of Weekly Windfalls, which will allow you to watch me trade in real-time – and cash some big checks, like Leslie here!
[Ed. Note: Jason Bond runs
JasonBondPicks.com and TheWeeklyWindfalls.com. In 2015 he earned a 180% return on his money. Then in 2016 he turned a $100,000 account into $430,000! Discover How He Did It]
Source: TheWeeklyWindfalls.com | Original Link
