I remember when I discovered the power of swing points… each holding more information than a library.
At first, I wanted to know how to pick off the top or bottom of a reversal. Turns out I was asking the wrong question.
The right question is: what can swing points tell me?
The answer – key support and resistance levels!
People who study charts swear by these reference points… and for good reason. These areas work with any chart on any time frame. This versatility means more money in your trading account.
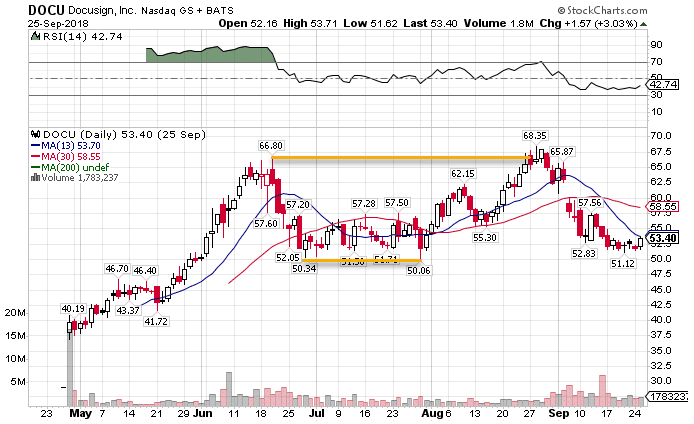
Take DOCU for example, a stock that recently had its IPO. Look at how the swing points on the daily chart highlighted levels that acted as support and resistance.

I use these all the time to set up my swing trades in Weekly Money Multiplier.
I want to show you how you can use these on any chart and any time-frame to find great setups.
How to identify swing points
Before you use them for setups, you need to know how to spot these swing points. So let’s quickly go over what they look like.
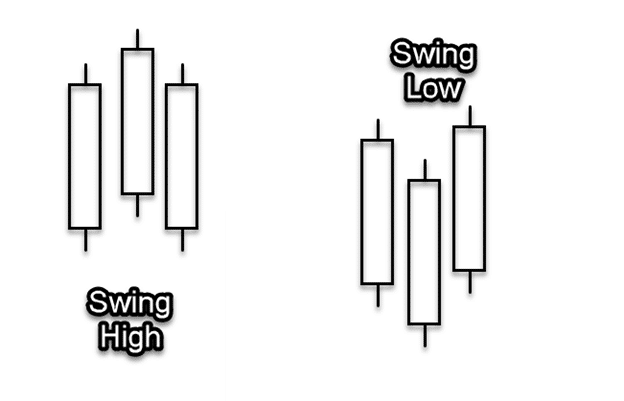
Swing points and pivot points are often used interchangeably. You need three candles to form a swing point. For swing highs you want the middle candle’s high to be higher than the highest point on the other two candles. With a swing low, the candle should be lower than the lowest point on the other two candles.
It looks something like this:

A lot of traders struggle to identify the correct swing points. It does take some practice. But here’s some basic rules to work with.
- You can have multiple candles with the exact same high or low. Those work fine as long as the highs or lows of the candles adjacent are below/above them.
- The longer it’s been since that swing point, the more important it is.
- Swing points from longer-time frames are more important than ones from lower time frames.
- Multiple swing points in the same area indicate an important level
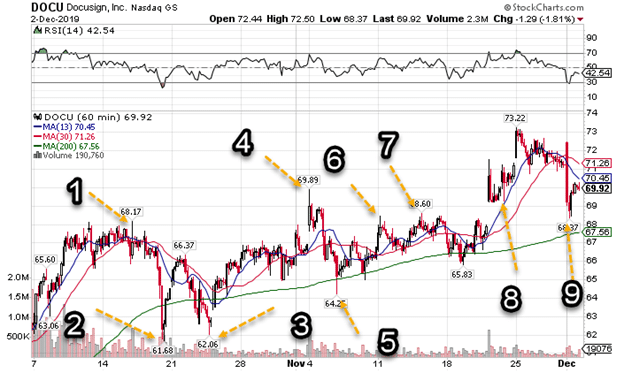
Let’s check out how this might work in a sample chart. I pulled an hourly chart of DOCU for our example. The arrows point to different swing points on the chart. This isn’t every swing point, just some of them.

DOCU hourly chart
You should quickly see some patterns here. Notice how 2 & 3 come in at near the same level. When 3 was formed, it used 2 as a reference. Look at number 1. Notice how 6 and 7 work at similar areas. Why did 4 move past that? It happens sometimes.
But here’s where the magic really happens. Notice how 8 & 9 are pretty close to one another. Now, imagine a line drawn between 1, 6 & 7. That would come right to the underside of 8 & 9!
Pretty cool stuff!
Now that we know how to identify these levels, let’s talk about how to use them to create trades.
Use them in conjunction to find setups
Trade setups contain several components: timing, levels, and patterns. The swing points give us the levels to work with. So, we need to then decide on the timing and patterns.
My strategy finds stocks that have strong trends, show a consolidation pattern, and are undergoing a squeeze. I often use swing points to identify my targets and stops.
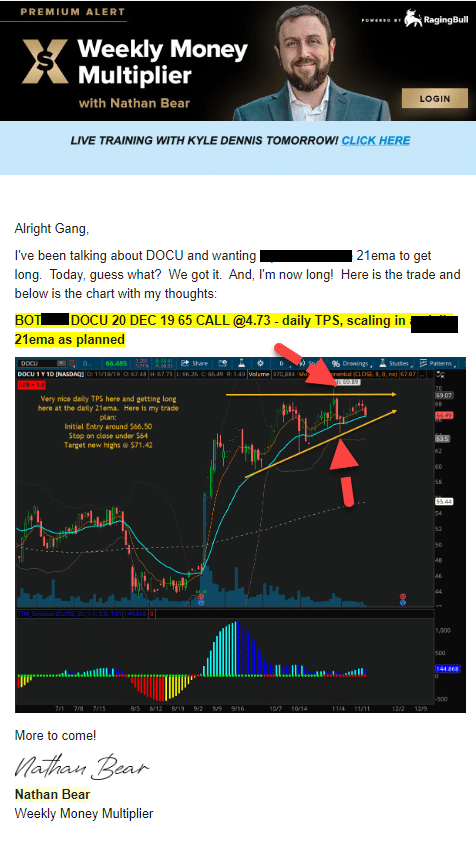
Let’s look at a recent example. Here is an email that I sent to Weekly Money Multiplier members outlining the trade on… you guessed it, DOCU.

I want you to look at the red arrows. Those point to key swing points in my trade. I knew that if DOCU closed daily below the bottom swing point, that support failed, and it would head lower. Conversely, if it broke through the swing high, then the resistance failed.
My TPS system works on the premise that these setups build enough energy to punch through the upper resistance. I found a stock that had a clear uptrend established over several weeks. Then, I looked for a consolidation pattern, which I drew in the chart. Lastly, I wanted to see a squeeze, which the red dots at the bottom indicate.
Note: A squeeze is where the Bollinger Band indicator trades inside the Keltner Channel indicator. This delivers my timing component.
In this case, it worked out beautifully.

Not a bad swing trade!
Charts speak volumes if you know how to listen. That’s why I like my live sessions in Weekly Money Multiplier, where I get to go over these examples and field questions from members.
Click Here to Join Weekly Money Multiplier.
Source: Ragingbull.com | Original Link