When President Trump ordered an airstrike in Iraq last week—killing one Iran’s most powerful generals—stocks tumbled on Friday—safe-haven assets like gold and treasuries surged.
With geopolitical tensions rising, it seemed like we were setting up for a long-overdue selloff.
Not so fast…
As quickly as the bearish headlines hit the tape… fresh ones appeared yesterday stating that tensions between Iran have eased… pushing stocks back to all-time high territory.
One thing is clear though…
This has now become a news-driven market again. One that is extremely difficult to trade if you are a swing trader.
Good trading is all about making adjustments. And one adjustment we all should consider is tightening up the amount of time we’re in trades.
After all, we’re just one headline away from seeing a winning position turn into a loser.
That’s why scalping strategies are so important in a time like this.
Scalping is all about taking advantage of sudden and short moves in stocks.
In and out…
Having short-term strategies are essential in a market like this one.
That’s why I’m going to walk you through the different elements of the trade—with some real money case studies.
The Almost Trade
As futures were taking a nosedive overnight, I spotted an area that I thought looked ripe for the plucking. Most of my trades rely on the 8-period and 21-period exponential moving averages for my entry.
I use these specific indicators because I found they act as support and resistance, especially on the daily chart. When I looked at the Nasdaq futures chart, the level became obvious.
Here’s the daily chart of Nasdaq futures.
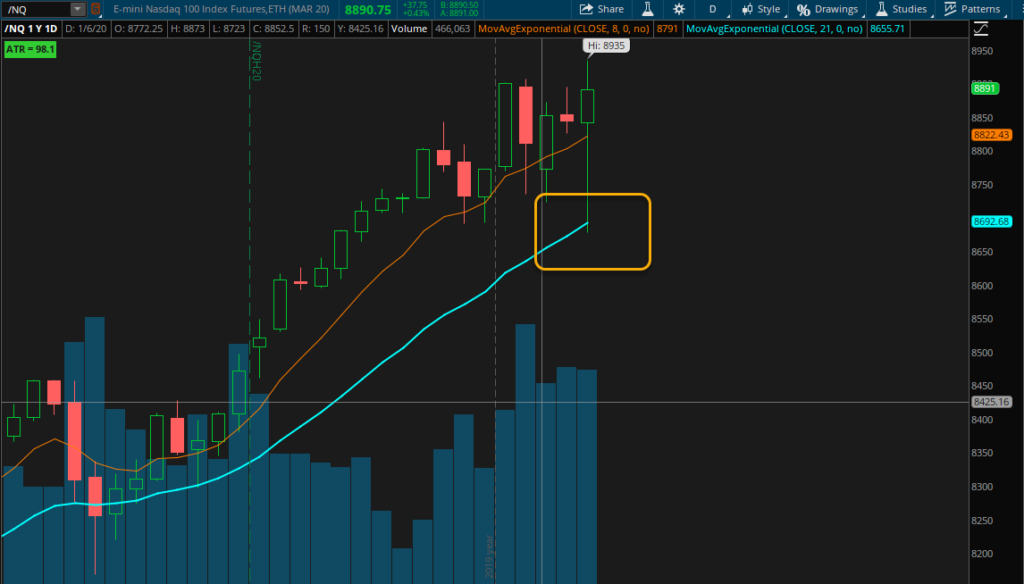
Nasdaq futures daily chart
At first glance, it looks like futures hit the moving average dead on. Unfortunately for me, that line adjusts as more data comes in, and it was a few ticks lower than the bottom.
However, my basic trade pattern for this scalp was as follows:
- Entry at a strike of the 21-EMA
- Take off the trade at my first target at the last consolidation area on the 5-minute chart
- Otherwise, use a tight stop of about 20 points
Now, let’s compare that to my standard TPS setup. A typical TPS setup involves:
- Entry between the 8 and 21 exponential moving averages
- My exit is a close below the lower Bollinger Band
- My first target is a 127.2% extension above the current trading range
At first, these seem entirely different. However, let me point out that the trades have all three of these characteristics before I enter:
- Entry area
- Target area
- Stop level
Regardless of whether I’m trading a scalp or a swing trade, I can always define these before I enter the trade. And, while the futures trade doesn’t follow my normal TPS pattern, I often trade TPS scalps the same way as my swing trades.
Adjusting your trades for scalps
Now, there are some key differences between scalping and swing trading. The most obvious is the size of the move you’re trying to play.
Swing trades may try to capture a 1% move in a stock over a matter of days or weeks. Scalps may try to get 0.10% from a stock in a matter of seconds or minutes.
So, I adjust the amount I trade accordingly. Say I normally risk $500 on a swing trade as my maximum potential loss. If I wanted to maintain that same exposure on a scalp, I would need to increase the amount of money I trade.
How much? Roughly 10x if I’m comparing a 1% swing trade to a 0.1% scalp trade.
The second adjustment I make for scalps is generally taking most or all of my trade-off at my primary target. With swing trades, the difference between your first and second targets can be several dollars.
However, scalp trades might only be a few pennies. The additional risk vs the reward there doesn’t pay, especially if the bid/ask spread is too wide.
The third adjustment I make for scalping is monitoring market internals. I look at broader market indexes to understand whether stocks are trading in a bullish or bearish environment. This includes looking at the VIX, advancing vs declining stocks, as well as the sector ETF the stock trades within.
An example in action
Let’s go over an example of a trade I had in Target (TGT) off the back of their earnings. Early in the morning, I noted the move in my email to Weekly Money Multiplier subscribers.
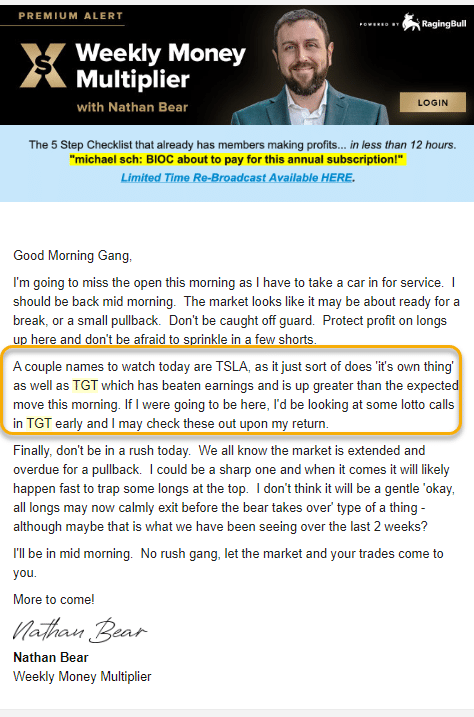
I highlighted the stock would open higher than traders had expected. So, I waited for a pullback. Using the 5-minute chart, I got the following setup.
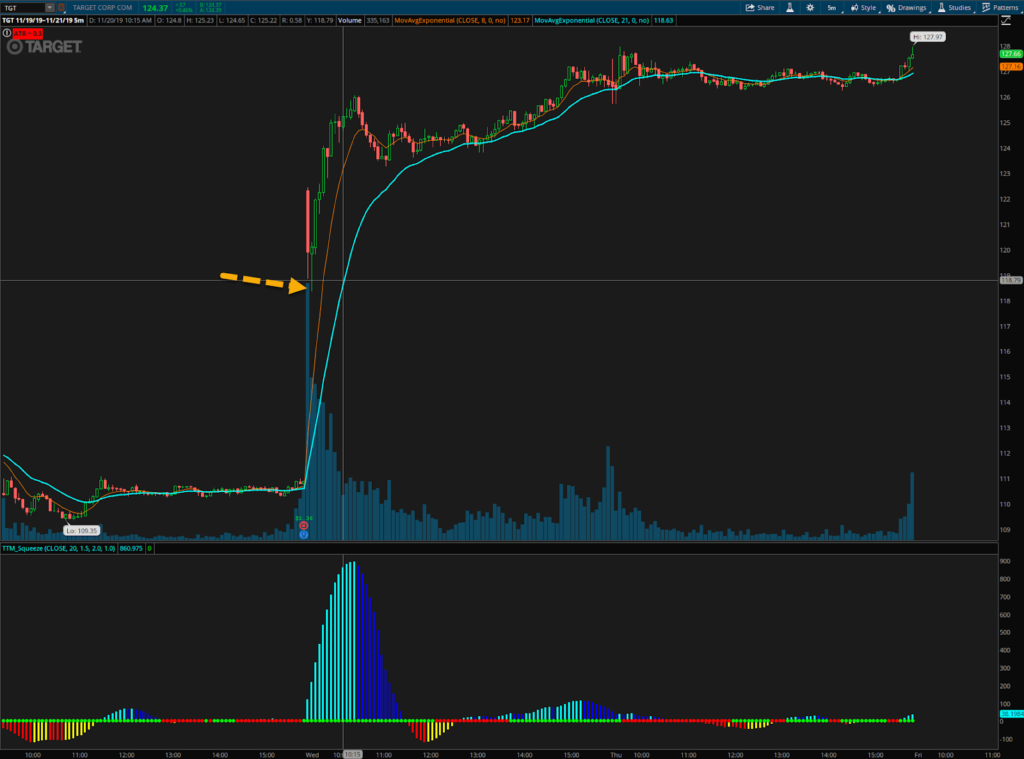
TGT 5-minute chart
The arrow points to the reversal candle I used for my trade. It was a simple, straightforward plan. If I got a 5-minute close below the candle I was out of the trade. Otherwise, I was looking for the stock to trade above the opening 5-minute range.
This trade worked out picture perfect and then some.
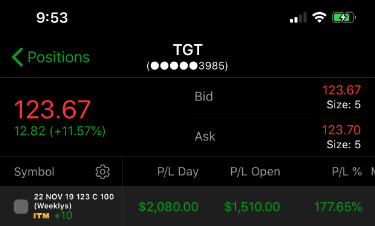
Every one of my trades, whether swing trades or scalps have clearly defined entries, targets, and stops with proper risk management.
I spoke at length about how I discovered the strategies that worked for me in my recent interview. You can catch a replay of it here.
Click here to watch the replay.
Source: Weeklymoneymultiplier.com | Original Link